
Data That Supports Your Experience Insights that strengthen outcomes
Institutional Research and Assessment (IRA) supports Presbyterian College by providing data, analysis, and consultation for institutional planning and assessment. Through collaboration across campus, the office conducts research that strengthens institutional effectiveness, supports accreditation, and helps improve student success.
National Student Clearinghouse
Student Insights Dashboard
Explore national data on student enrollment, degree completion, and post-graduate pathways through this interactive tool provided by the National Student Clearinghouse. Discover how student journeys unfold beyond the classroom and after graduation.
Student Achievement
Student achievement at Presbyterian College reflects both our commitment to academic excellence and our mission to prepare graduates for meaningful impact. We track key outcomes to ensure students are supported, challenged, and prepared for success during their time at PC and beyond.
In accordance with the Southern Association of Colleges and Schools Commission on Colleges (SACSCOC) Standard 8.1, “The institution identifies, evaluates, and publishes goals and outcomes for student achievement appropriate to the institution’s mission…,” Presbyterian College has identified student achievement metrics, provided appropriate data, established thresholds of acceptability, and explained how each criterion relates to its mission.
Presbyterian College’s mission statement indicates that the College is dedicated to helping students “gain a basic knowledge of humanities, natural sciences, and social sciences; a special competence in one or more particular areas of study; and an ability to see these studies as part of the larger search for truth.” Each measure is in alignment with the College’s mission statement. The College strives to attain the highest student achievement outcomes possible, which often exceed those of the regional average of Liberal Arts Colleges.
Institutional Goals for Student Achievement
The College holds five goals for student achievement and success:
- Graduation Rate Performance
Six-year graduation rates (150% of normal enrollment length) of first-time, full-time, bachelor’s degree seeking students will exceed the Southeast Regional average.
- Student Retention
Fall-to-fall retention rates for first-time, full-time, bachelor’s degree seeking students at PC will exceed the Southeast Regional average.
- Career Outcomes
Overall career outcome rates for baccalaureate graduates will exceed the National Association of Colleges and Employers (NACE) Southeast Regional rate.
- Licensure & Certification Success
The College will meet or exceed national/state pass rates for its Education Department programs leading to licensure or certification.
- Graduate Program Completion Rates
The College’s graduate programs will meet or exceed the following on-time graduation rates:
School of Pharmacy: 76%
Physician Assistant Studies: 90%
Occupational Therapy: 90%
Undergraduate Programs Graduation Rates
At PC, we’re with you from orientation to commencement. Our four-year and six-year graduation rates reflect a community that invests in your success every step of the way.
The following table includes PC’s 4-year and 6-year undergraduate graduation rates of incoming first-time students from the entering cohorts of 2016 through 2019.
| Reporting Year | Cohort Year | 4-Year Graduation Rate | 6-Year Graduation Rate |
|---|---|---|---|
| 2022 | 2016 | 54% | 63% |
| 2023 | 2017 | 53% | 62% |
| 2024 | 2018 | 48% | 51% |
| 2025 | 2019 | 43% | 52% |

Presbyterian College monitors and reports graduation rates according to the guidelines of the Graduation Rate Survey (GRS), a component of the Integrated Postsecondary Education Data Systems (IPEDS).
Each year, IPEDS delivers a Data Feedback Report comparing Presbyterian College to 23 aspirational peer institutions. NCES also provides multi-year 6-year graduation rates for national and regional peer institutions for additional comparison.
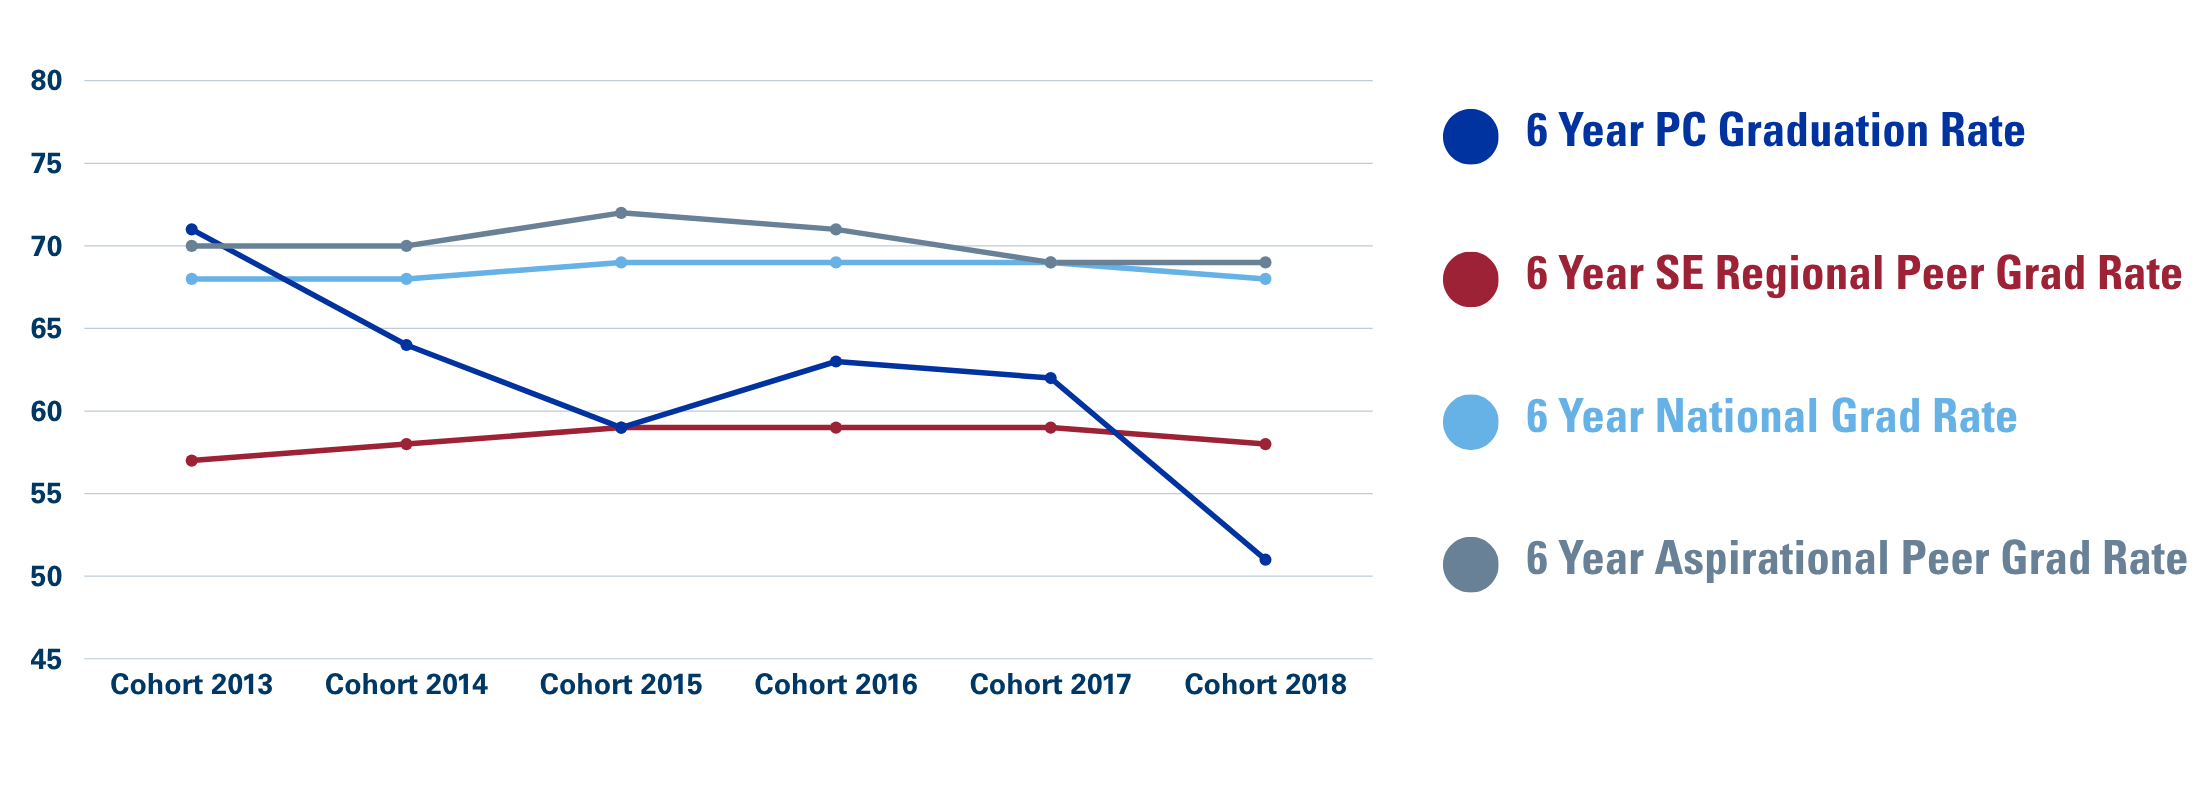
Undergraduate Six-Year Graduation Rates How We Compare
We don’t just track our own numbers — we measure ourselves against the best. The following chart represents Presbyterian College’s 6-year undergraduate graduation rates in comparison to those of its aspirational peers as well as the rates for the national and southeast regional, four-year, bachelor degree-granting, private non-profit peer institutions.
Graduate Programs Graduation Rates
Our graduate programs are intensive, focused, and designed to take you all the way through. The following table represents the percentage of graduate students who completed the Pharmacy Doctoral degree within four years, the Physician Assistant Studies program within two years, and the Occupational Therapy Program within three years.
| Graduation Year | Pharmacy | Physician Assistant | Occupational Therapy |
|---|---|---|---|
| 2021 | 78% | 100% | * |
| 2022 | 79% | 97% | * |
| 2023 | 68% | 97% | 87% |
| 2024 | 53% | 86% | 100% |
| 2025 | 77% | 94% | 95% |
*Occupational Therapy graduated its first cohort of students in 2023.
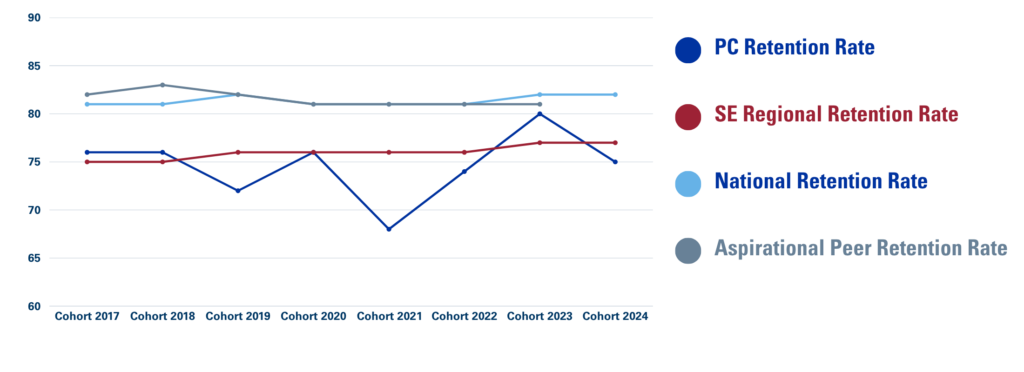
Undergraduate Programs Retention Rates
The following chart represents Presbyterian College’s fall-to-fall, first-year to sophomore year undergraduate retention rates in comparison to those of its aspirational peers as well as the national and southeast regional, four-year, bachelor degree-granting, private non-profit peer institutions for the past eight cohorts.

The PC Experience
WHAT OUR STUDENTS SAY
The National Survey of Student Engagement (NSSE) gathers information from colleges and universities about student participation in programs and activities that institutions provide for student learning and personal development. The results provide an estimate of how undergraduates spend their time and what they gain from attending college.
93%
Of PC Seniors rated their overall experience as Excellent or Good, compared to a 87% rating for our Liberal Arts Peers
89%
Of seniors say PC has contributed to their ability to think critically and analytically
87%
Of seniors would choose PC again, compared to a 78% rating for our Liberal Arts Peers